Wolfcamp Play Map
Horizontal Production by Landing Bench
Summary
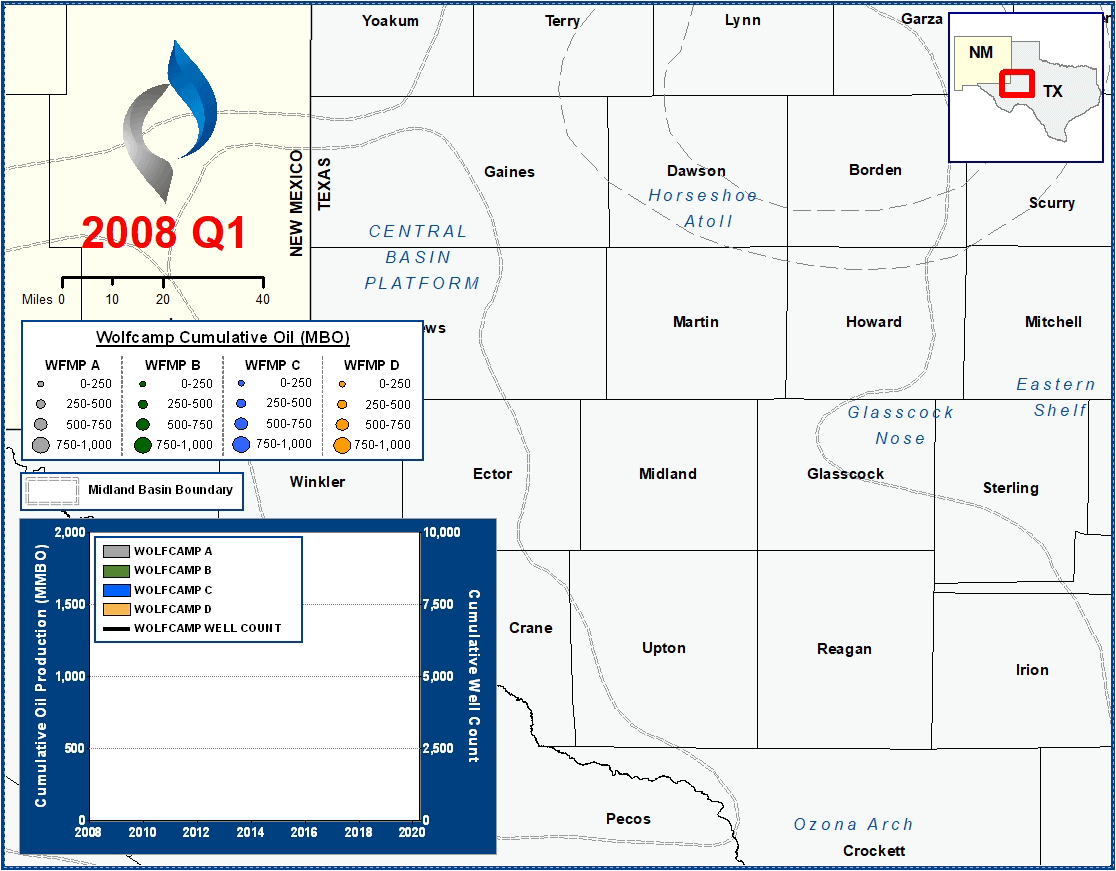
The graphic above presents cumulative Midland Basin oil production for all horizontals completed since 2008 in the Wolfcamp. The Wolfcamp is typically divided further into four intervals:
- Wolfcamp A (“WFMP A”) – Along with the Wolfcamp B, this interval represents a primary target in the Basin. Horizontal development generally followed upon early results in the Wolfcamp B, and best results to date have been in Martin, Howard, and Midland Counties. The interval has relatively low in-situ water saturations, but wellbores targeting this zone may nevertheless produce notable water volumes if in communication with mobile water from the Dean (above) or Wolfcamp B (below) intervals.
- Wolfcamp B (“WFMP B”) – During the onset of the play (through 2015), the Wolfcamp B was the initial primary target for horizontal wellbores. Due to significant thickness in certain parts of the Basin, it is commonly sub-divided into the ‘B Upper’ and ‘B Lower.’ Towards the southern part of the Basin (in Irion and Crockett Counties), the interval becomes very shallow and exhibits higher Gas-Oil Ratios.
- Wolfcamp C (“WFMP C”) – Relative to the two shallower targets, the Wolfcamp C has been less developed. This interval has lower organic content, but has been targeted in certain Upton County wellbores.
- Wolfcamp D (“WFMP D”) – Like the Wolfcamp C, the Wolfcamp D has not been heavily developed throughout the Midland Basin. This interval is highly laminated and has variable lithology.
Methodology Overview
VSO reviewed and correlated formation tops across more than 600 digital and raster open hole logs throughout the Midland Basin. We subsequently created and QC’d structure maps for all key intervals within the Basin. After analyzing the placement of each horizontal wellbore relative to our structural interpretations, landing benches were assigned for all wells.
Reservoir & Geologic Studies
VSO has completed extensive analysis of well performance and productivity throughout the Midland Basin. Additional reservoir and geologic capabilities include:
Assessment of Development Potential and Risks
Type Well Analysis
Evaluation of Well Performance and Interference
Midstream/Supply Studies
Audits/Evaluations of Producing Assets
Key Cross-Sections
Reservoir Quality Maps – Porosity, TOC, OOIP
Upside development Reservoir Quantity Maps – Gross and Net Isopachs
Pressure Trends
Maturity & GOR Impacts